Learn how Fibonacci time-based analysis predicts market cycles, key turning points, and how to combine it with other technical indicators for better trading results.
Fibonacci Time-Based Analysis: A Powerful Tool for Predicting Market Cycles
Fibonacci Time-Based analysis is a popular tool among traders and technical analysts that helps predict potential market turning points. By applying the principles of the Fibonacci sequence to time intervals, traders can estimate when significant price movements are likely to occur. This powerful method is rooted in Fibonacci retracements, but instead of focusing on price levels, it focuses on the timing of market cycles. In this article, we will dive deep into how Fibonacci time zones work, why they are essential, and how traders can integrate them into their trading strategies.
What is Fibonacci Time-Based Analysis?
Fibonacci time-based analysis revolves around the Fibonacci sequence, a series of numbers that naturally occurs in various aspects of nature, art, and mathematics. These numbers are 0, 1, 1, 2, 3, 5, 8, 13, 21, and so on, where each number is the sum of the two preceding numbers. In trading, Fibonacci levels are often used to predict potential support and resistance levels. However, when applied to time rather than price, these numbers help identify potential periods in which significant price reversals or trend continuations may occur.
Fibonacci Time Zones Explained
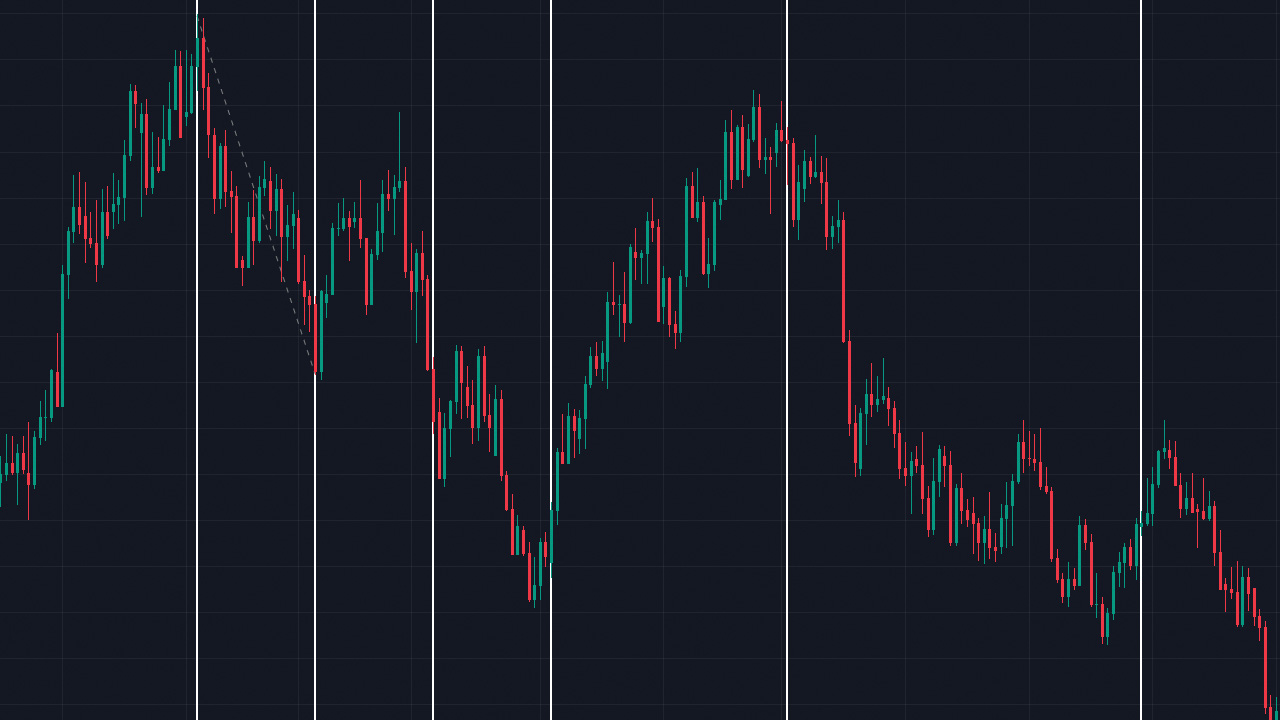
Fibonacci time zones are vertical lines drawn on a price chart at intervals based on Fibonacci numbers. These lines represent potential turning points in the market. The first time zone is drawn from a major swing high or swing low, with subsequent zones placed at Fibonacci intervals (1, 2, 3, 5, 8, 13, 21, and so on). The idea is that price may experience significant changes at these points in time, signaling a trend reversal or continuation.
For instance, if a stock experiences a strong rally and then retraces, Fibonacci time zones can help traders determine when the price might be ready to reverse or break out again. By analyzing past price movements, traders can estimate when similar price action may occur in the future.
How to Apply Fibonacci Time-Based Analysis
To apply Fibonacci time zones effectively, traders need to identify a significant starting point, such as a swing high or swing low. From this point, the Fibonacci time zones are drawn, each corresponding to a Fibonacci number. These zones provide visual markers for potential future price movements.
Steps to Use Fibonacci Time-Based Analysis
1. Identify the Starting Point by Fibonacci: Begin by selecting a significant high or low point on the price chart. This should be a major turning point in the market, where a significant price reversal occurred.
2. Draw the Fibonacci Time Zones: Using your charting software, plot the Fibonacci time zones starting from your selected point. These vertical lines will appear at intervals based on Fibonacci numbers (1, 2, 3, 5, 8, 13, 21, and so on).
3. Analyze Market Movements: Monitor the price as it approaches each time zone. At these intervals, significant price movements such as reversals or trend continuations may occur.
4. Combine with Other Indicators: Fibonacci time zones should not be used in isolation. They are most effective when combined with other technical analysis tools, such as support and resistance levels, moving averages, or momentum indicators. This helps confirm potential market turning points and increases the probability of making successful trades.
Why Fibonacci Time Zones Are Important
Fibonacci time-based analysis adds an extra dimension to technical analysis by incorporating time, not just price, into the equation. This makes it a powerful tool for anticipating future market movements. Here's why Fibonacci time zones are important:
Predicting Market Timing
While traditional Fibonacci retracement tools focus on predicting price levels where reversals might occur, Fibonacci time zones predict when these reversals might happen. Time is often overlooked in trading, but it can play a crucial role in understanding market cycles. By identifying periods of time when price action may shift, traders can better time their entries and exits.
Identifying Market Cycles
Markets often move in cycles, alternating between periods of expansion and contraction. Fibonacci time-based analysis helps identify these cycles by marking out potential turning points based on past price action. This can be particularly useful for long-term investors and swing traders who seek to capture major market trends.
Enhancing Risk Management
By incorporating Fibonacci time zones into their trading strategies, traders can improve their risk management. Knowing when a market is likely to reverse or consolidate allows traders to set more effective stop-loss orders, manage leverage more cautiously, and plan their trades with greater precision. Time-based analysis also helps avoid holding positions too long and missing out on profit opportunities.
How to Combine Fibonacci Time Zones with Other Technical Indicators
Fibonacci time-based analysis is most effective when combined with other technical indicators. Using multiple forms of analysis increases the likelihood of accurately predicting market movements. Below are some key indicators that work well alongside Fibonacci time zones:
Support and Resistance Levels
Support and resistance levels provide key areas where price may reverse or break out. When these levels coincide with Fibonacci time zones, it can create a strong signal for a potential trade. For instance, if a Fibonacci time zone is aligned with a major support level, the chances of a bounce are higher, and traders can consider entering a long position.
Moving Averages
Moving averages are a popular indicator for identifying the overall trend direction. Combining Fibonacci time zones with moving averages helps confirm potential reversals. If price approaches a Fibonacci time zone and the price is also near a major moving average, it increases the likelihood of a trend change.
Momentum Indicators
Momentum indicators like the Relative Strength Index (RSI) or MACD (Moving Average Convergence Divergence) measure the strength of a trend. When momentum begins to fade around a Fibonacci time zone, it can signal an impending reversal. Traders can use these signals to confirm whether the market is likely to change direction.
Chart Patterns
Chart patterns, such as head and shoulders, double tops, or triangles, can also be used in conjunction with Fibonacci time zones. When a chart pattern forms near a Fibonacci time zone, it strengthens the probability of a breakout or reversal. These patterns, when confirmed by time-based analysis, offer traders high-probability setups.
Common Mistakes When Using Fibonacci Time-Based Analysis
While Fibonacci time zones are a powerful tool, traders should be aware of some common mistakes when using this method:
1. Over-Reliance on Fibonacci Time Zones
One of the most common mistakes traders make is relying solely on Fibonacci time zones without considering other forms of analysis. While time zones provide valuable insight into potential turning points, they should be used in conjunction with other technical indicators to confirm trade signals.
2. Incorrect Starting Point
The effectiveness of Fibonacci time zones depends on selecting the correct starting point. Choosing a minor swing high or low can lead to inaccurate predictions. Always use significant market highs and lows to draw your Fibonacci time zones for more reliable results.
3. Ignoring Market Conditions
Market conditions, such as volatility and news events, can impact price action and the timing of market reversals. Traders should always consider the broader market context when applying Fibonacci time zones and adjust their strategy accordingly. Ignoring market conditions can result in missed opportunities or premature trade entries.
Examples of Fibonacci Time-Based Analysis in Trading
1. Applying Fibonacci Time Zones in Forex Trading
In Forex trading, where currencies often move in strong trends, Fibonacci time zones can be especially useful. For example, after a major move in EUR/USD, traders can apply Fibonacci time zones from the most recent swing low. As the price approaches key Fibonacci time intervals, traders can look for confirmation from price action or other technical indicators to enter or exit trades.
2. Using Fibonacci Time Zones in Stock Trading
Stock traders can also benefit from Fibonacci time-based analysis. After a strong rally in a stock, applying Fibonacci time zones can help identify when the price may begin to consolidate or reverse. For example, if a stock has risen significantly over several months, Fibonacci time zones can provide traders with an estimate of when the stock might experience a correction or resume its upward trend.
3. Fibonacci Time Zones in Cryptocurrency Trading
With the high volatility of cryptocurrencies, Fibonacci time-based analysis can help traders navigate these unpredictable markets. After a major move in Bitcoin or Ethereum, Fibonacci time zones can highlight periods when price may experience heightened volatility or reversal. This can help crypto traders time their entries and exits more effectively.
Conclusion: Mastering Fibonacci Time-Based Analysis
Fibonacci time-based analysis is a valuable tool for traders seeking to predict market cycles and turning points. By applying Fibonacci time zones to a price chart, traders can estimate when significant price movements may occur. However, it’s essential to combine this tool with other forms of technical analysis, such as support and resistance levels, moving averages, and momentum indicators, to increase the probability of successful trades.
Whether you’re trading Forex, stocks, or cryptocurrencies, incorporating Fibonacci time-based analysis into your strategy can provide a deeper understanding of market timing and help you make more informed trading decisions. With practice and a thorough understanding of how to use Fibonacci time zones, traders can better anticipate market changes and capitalize on key opportunities.
Published by:
 Daniel Carter